BizBench : Home

Balance Sheet Comparison Summary

Balance Sheet Analysis – Building Owner Equity

The Balance Sheet Comparison Summary charts the actual dollar amounts for each Balance Sheet category, converts it into a percent of total assets and benchmarks the percentage against the percentage of total assets for the industry standard for both Asset and Liability categories. This normalizes the report as actual amounts would vary more than the percentages of total assets.

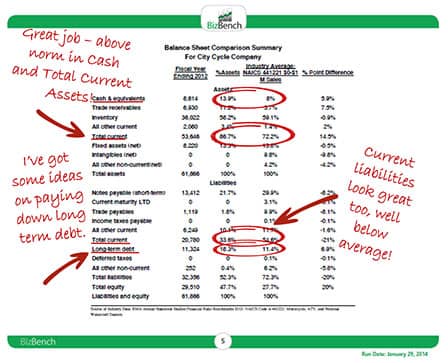
In this sample, you can see that City Cycle is well above average in Current Assets and well below average for Current Liabilities, though Long Term Liabilities are greater. What else can you see? How would you advise to pay down the long term debt and increase owner equity in light of Cash & Equivalents being well above the norm?


Can you see how easy this makes consulting your client or your management team on immediate steps that can be taken to improve the financial strength of a the company?

Simply order BizBench online today to take your client consultation to the next level!

SUBSCRIBE NOW

Flexible Options

1 month Access

Business Owner/Executive
$ 495
  • Detail and Summary Report
  • Word and PDF Formats
  • One Business
  • Support
  • Internet Accessible

1 Year Access
Course and Support

Accountant/Consultant
$ 1490
  • Detail and Summary Report
  • Word and PDF Formats
  • Unlimited Clients
  • Training and Support
  • Internet Accessible

1 year Access

Business Owner/Executive
$ 795
  • Detail and Summary Report
  • Word and PDF Formats
  • Unlimited Clients
  • Coaching, Training and Support
  • Internet Accessible

BizBench Reports benchmark a business against similar businesses in the same NAICS code in 51 key financial metrics using the extensive database of hundreds of thousands of businesses throughout North America.

Contact Us

12441 South 900 East #120 Draper, Utah 84020