BizBench : Home

The Summary Report

Your Client’s Window To Their Business

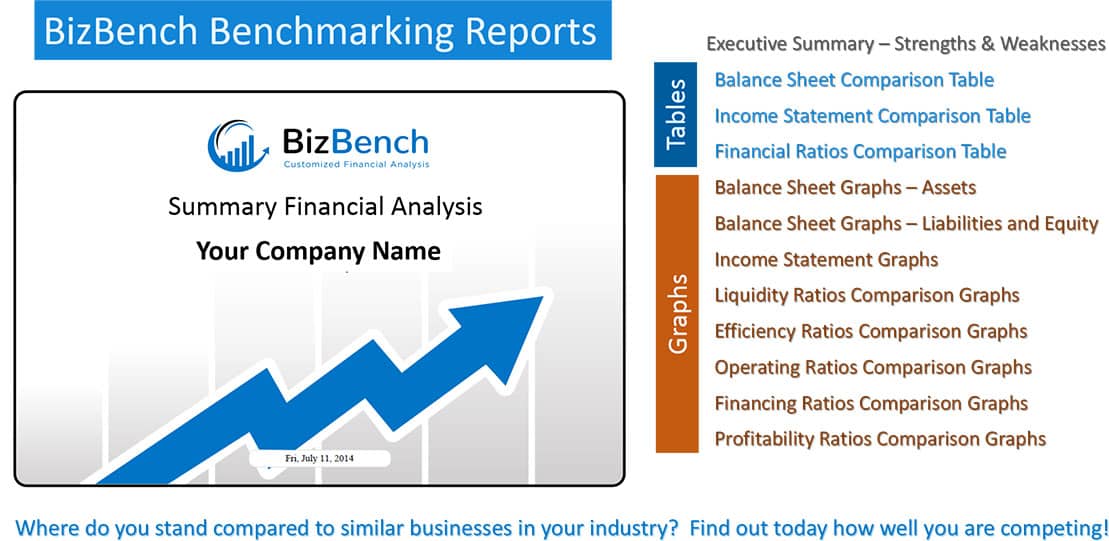
The summary report is a simplified version of the Detail Report, that is useful for your client to see what the report is showing without all the detail that can bog them down. It contains Executive Summary, the Comparison Tables, and the Comparison Graphs. This is perfect to give to a client in an initial or introductory consultation to follow along as you present using your detailed version. You can give them a copy of the detail report at the end of the consultation, or as you proceed through to the implementation of action items, or you can even charge extra for the detail report once you have them excited about the value of the report.

Look at all this report provides your client!

The summary report is a more concise version of the report that only includes the Executive Summary as well as the actual charts and graphs for each measurement. Omitted are the explanatory sections, as well as the higher analytical tools and lists of action items

It contains the following components

Executive Summary

Gives an overview of the Strengths and Weaknesses of the business based on those metrics from the balance sheet, income statement and financial ratios that are above the industry standard (Strengths) and below the industry standard (Weaknesses). The report standard can be set based on the percentile that the business is being measured against. The default is 50% or industry mean.

Balance Sheet Comparison Summary

Charts the performance of the business against industry standard by percentile for each metric taken from the Balance Sheet. Use this to consult on how to build Owner Equity

Income Statement Comparison Summary

Charts the performance of the business against industry standard by percentile for each metric taken from the Income Statement. Use this to consult on how to increase profits and retained earning.

Financial Ratio Comparison Summary

Charts the performance of the business against industry standard by percentile for each financial ratio.

Balance Sheet Comparison Summary Graphs

Graphically represents the company performance against industry standards for each metric from the Balance Sheet. Use this to graphically represent what can be done to increase owner’s equity.

Income Statement Comparison Summary Graphs

Graphically represents the company performance against industry standards for each metric from the Income Statement.

Financial Ratio Comparison Summary Graphs

Graphically represents the company performance against industry standards for each financial ratio.

SUBSCRIBE NOW

Flexible Options

1 Month Access

Business Owner/Executive

$495.00
  • User is able to access detail and summary report
  • User is able to access word and PDF formats
  • User is able to create one business
  • User is able to have support with the bizbench team if he/she needs help
  • User is able to have internet accessibility
Choose

1 Year Access Course and Support

Accountant/Consultant

Best Value
$1,490.00
  • User is able to see the detail and summary report
  • User is able to access the word and PDF formats
  • User is able to have unlimited clients in their business
  • User is able to have training and support with the bizbench team if he/she d’nt understand
  • User is able to have internet accessibility
Choose

1 year Access

Business Owner/Executive

Best Value
$795.00
  • User is able to access the detail and summary report
  • User is able to access the word and PDF formats
  • User is able to have unlimited clients in their business
  • User is able to have coaching,training and support with the bizbench team if they d’nt understand the business
  • User is able to have internet accessibility
Choose

1 month Access

Business Owner/Executive
$ 495
  • Detail and Summary Report
  • Word and PDF Formats
  • One Business
  • Support
  • Internet Accessible

1 Year Access
Course and Support

Accountant/Consultant
$ 1490
  • Detail and Summary Report
  • Word and PDF Formats
  • Unlimited Clients
  • Training and Support
  • Internet Accessible

1 year Access

Business Owner/Executive
$ 795
  • Detail and Summary Report
  • Word and PDF Formats
  • Unlimited Clients
  • Coaching, Training and Support
  • Internet Accessible

BizBench Reports benchmark a business against similar businesses in the same NAICS code in 51 key financial metrics using the extensive database of hundreds of thousands of businesses throughout North America.

Contact Us

12441 South 900 East #120 Draper, Utah 84020