BizBench : Home

Income Statement Summary Graph

Income Statement Summary Graph

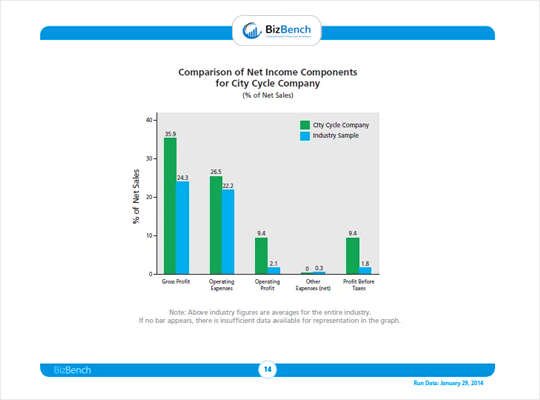
A graph can immediately convey what isn’t always as obvious when reading a table. BizBench graphs the Income Statement data as a percentage of Net Sales for a consistent comparison with industry standards across all Income Statement categories.

It’s easy to see the relationship here between City Cycle’s superior Net Sales position which more than compensates for their greater Operating Expenses which carries through to the Profit Before Taxes. Imagine what this graph could reveal about your client’s business or your own!

BizBench Reports benchmark a business against similar businesses in the same NAICS code in 51 key financial metrics using the extensive database of hundreds of thousands of businesses throughout North America.

Contact Us

12441 South 900 East #120 Draper, Utah 84020